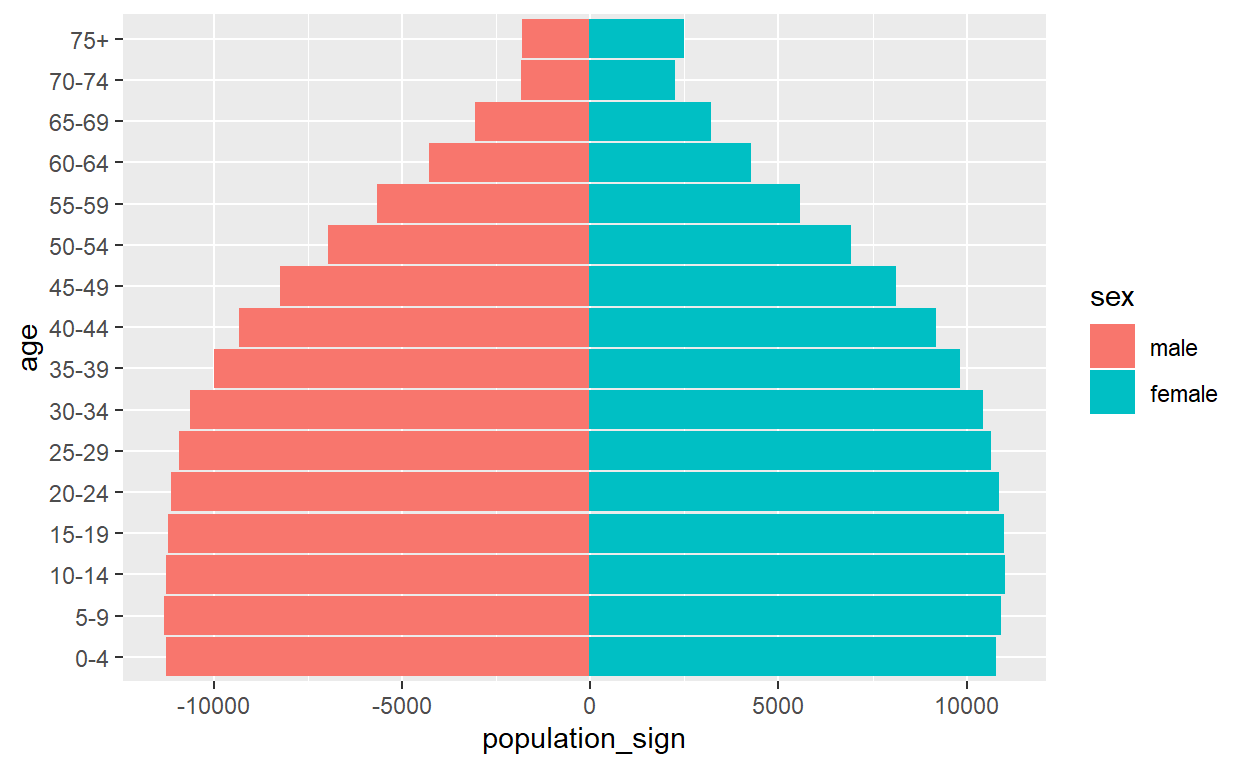
In this post i present a simple analysis of population structure using 3 main packages: dplyr, ggplot2, plotly. This post will demonstrate how to make a pyramid plot, calculating dependency ratio, and analyze similarity structure year to year. Case study in this post is Indonesia, using Population Projection Data based 2015 Intercensal survey by Statistics Indonesia (Badan Pusat Statistik).
Enjoy this blog? Get notified of new posts via email: